Bitcoin Block Time Variance: Theory vs Reality

This week I got pinged for a question that comes up from time to time:
How often does it happen that the chain doesn't mine a block for ~2 hours btw? Happened last night between 670637 and 638, something I accidentally noticed
— //Bitcoin 𝕵ack 🐐 (@BTC_JackSparrow) February 15, 2021
Looks like the two blocks were 106 minutes apart, which is very rare.
— Jameson Lopp (@lopp) February 15, 2021
If my math is right, exp(-106/10) = 0.0025% of blocks will be 106+ minutes apart assuming a constant hashrate.
This got me to thinking... how well has the expected block time distribution held up over the past 12 years?
I've previously discussed some aspects of Bitcoin's timestamping mechanics. Suffice to say that Bitcoin's security and game theory around timestamps is quite elegant.
Thankfully it's pretty easy to iterate through all of the bitcoin block headers for their timestamps if you have a node handy. I wrote this script to do so and on my laptop it only takes about 5 minutes to complete.
Note: for the purposes of my metrics I'm excluding the first 100 blocks in the blockchain, as some funky things happened during the first few days of Bitcoin's existence when only a few folks were mining.
It turns out that 190 blocks have occurred more than 106 minutes after the previous block, which is 0.0028% of the 670,000 blocks minted thus far. That's quite close to the expected value of 0.0025%! This was easy enough to calculate, but it only answered my question for one specific point in the block time delta distribution.
We've Got to Go Deeper
It's time to don our thinking caps! Felix Weiss answered the question of how to determine what percentage of blocks should be found before or after a certain amount of time has passed since the previous block.

The answer can be determined by calculating the cumulative distribution function (CDF) of the exponential distribution.
But what if we want to check how well the entire history of block time deltas has played out with regard to the expected distribution? In this case we want the probability density function (pdf) of an exponential distribution which can be modeled by f(x;λ) = λe^-(λx). In our case, x = the time since the last block and λ as the rate parameter is 1/600 (the targeted block time.) It should look like this on a linear scale:
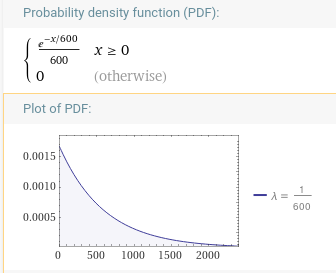
When I plotted the expected distribution for all blocks at time of writing, it looks pretty similar.
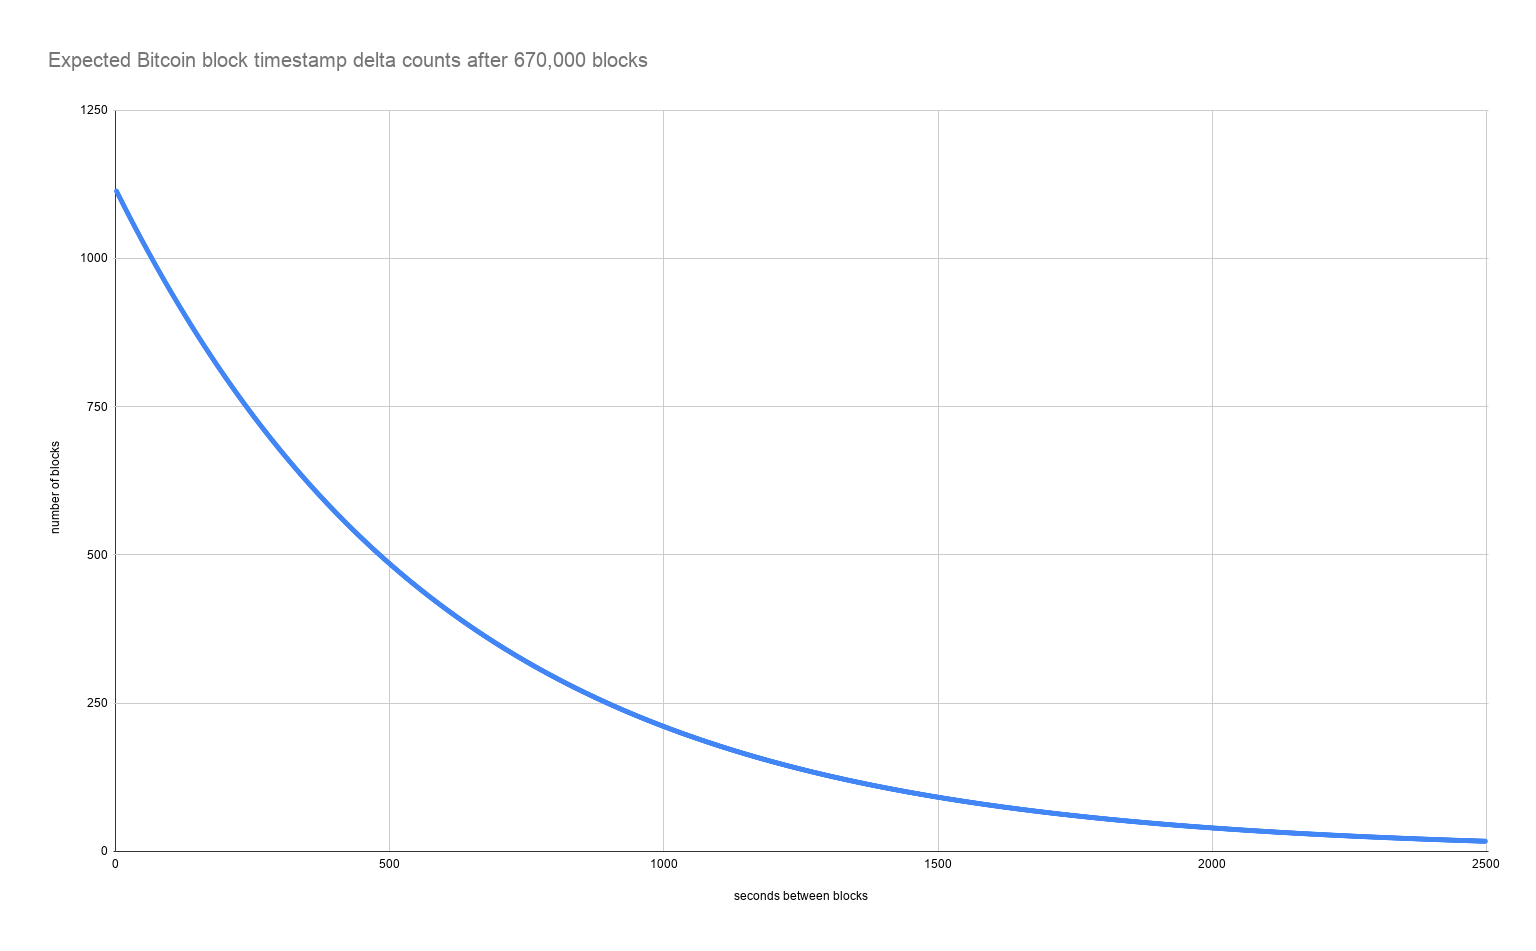
So I collected the data from the metrics script I wrote and imported it into this spreadsheet:

It quickly became apparent that it makes more sense to use log scale x axis on the following charts, otherwise you miss some interesting phenomena in the noise of the small deltas.
Mining Eras
The thing about the expected block time distribution is that it assumes a constant hashrate. As we know from history, Bitcoin's hashrate has been far from constant.
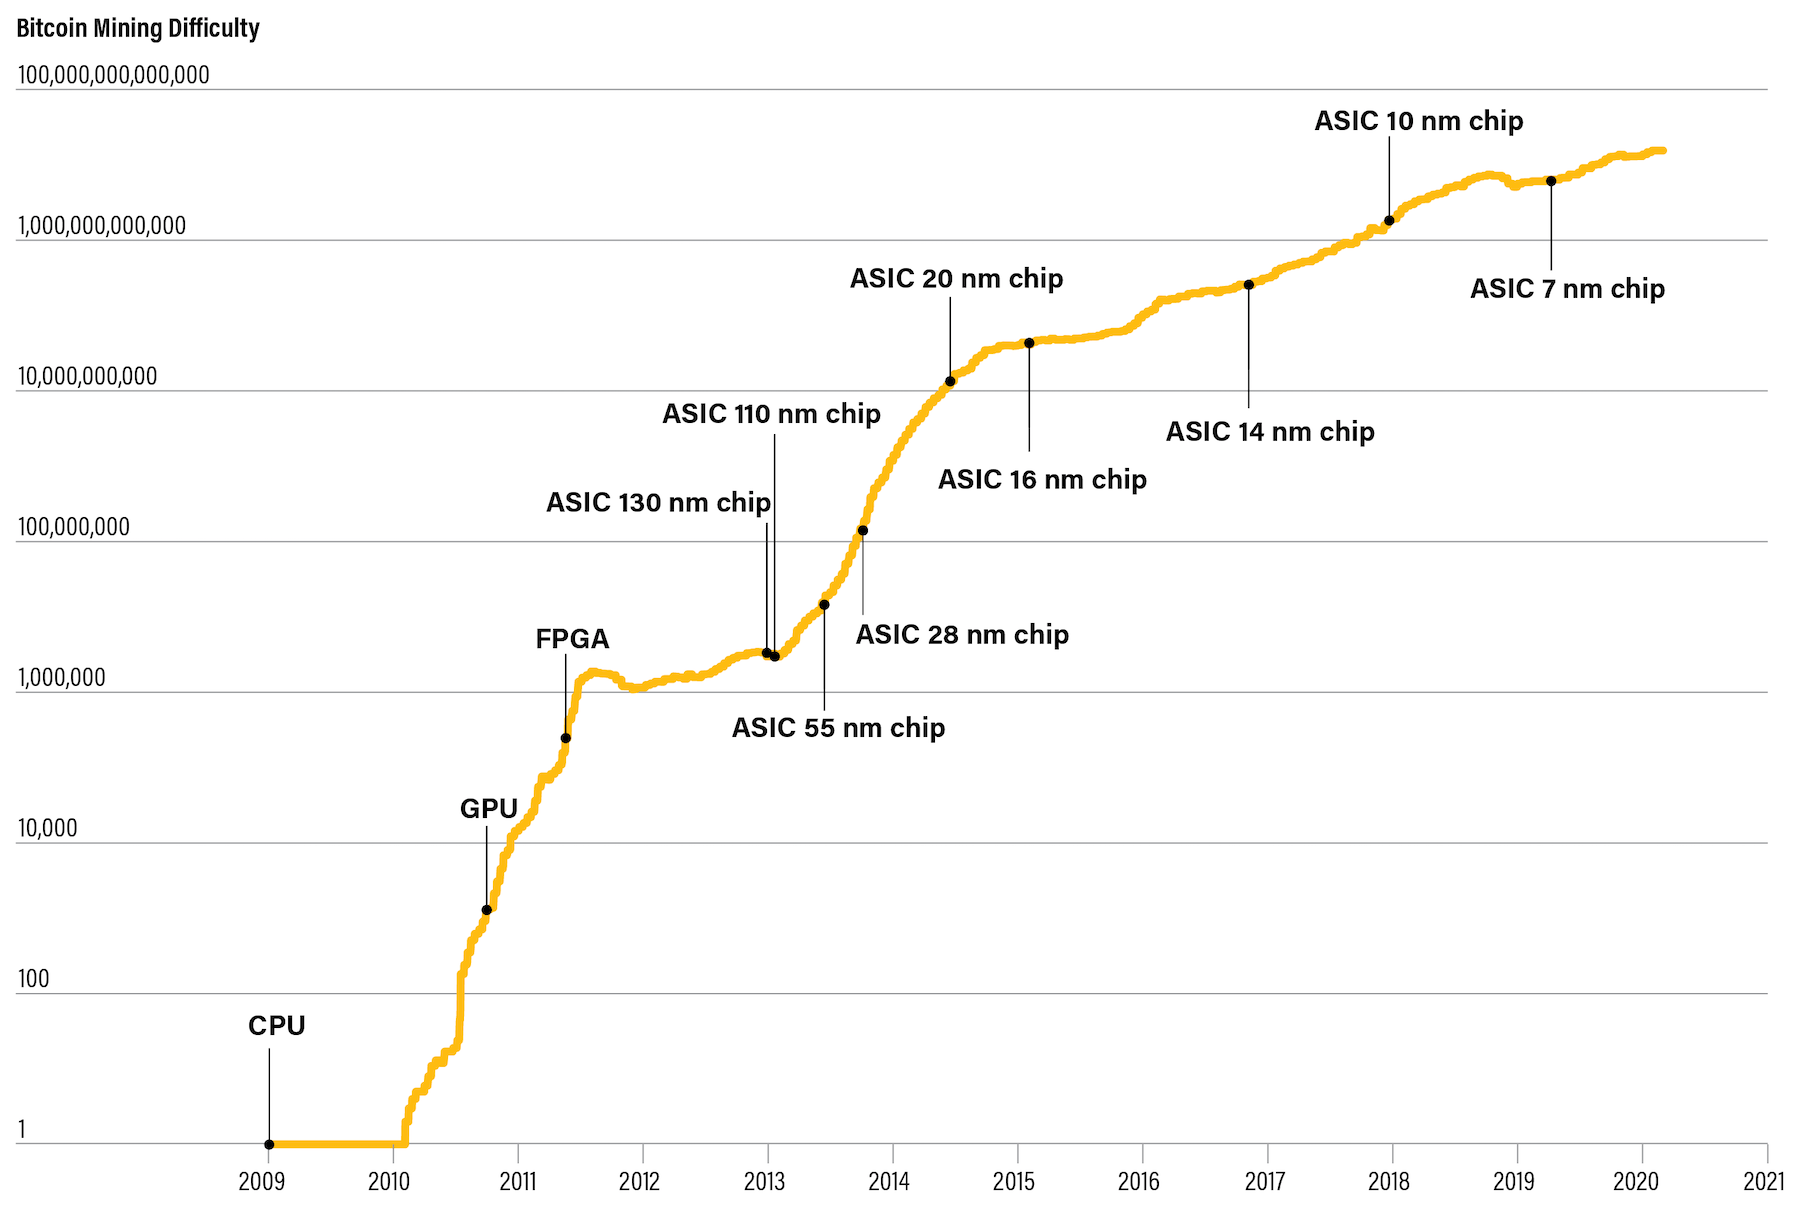
So I decided to take 3 different slices of block ranges.
- One from the CPU era where the hashrate was fairly flat
- One from the GPU era where it was quickly accelerating
- One from recent ASIC history where it's (relatively) slowly accelerating
CPU Era
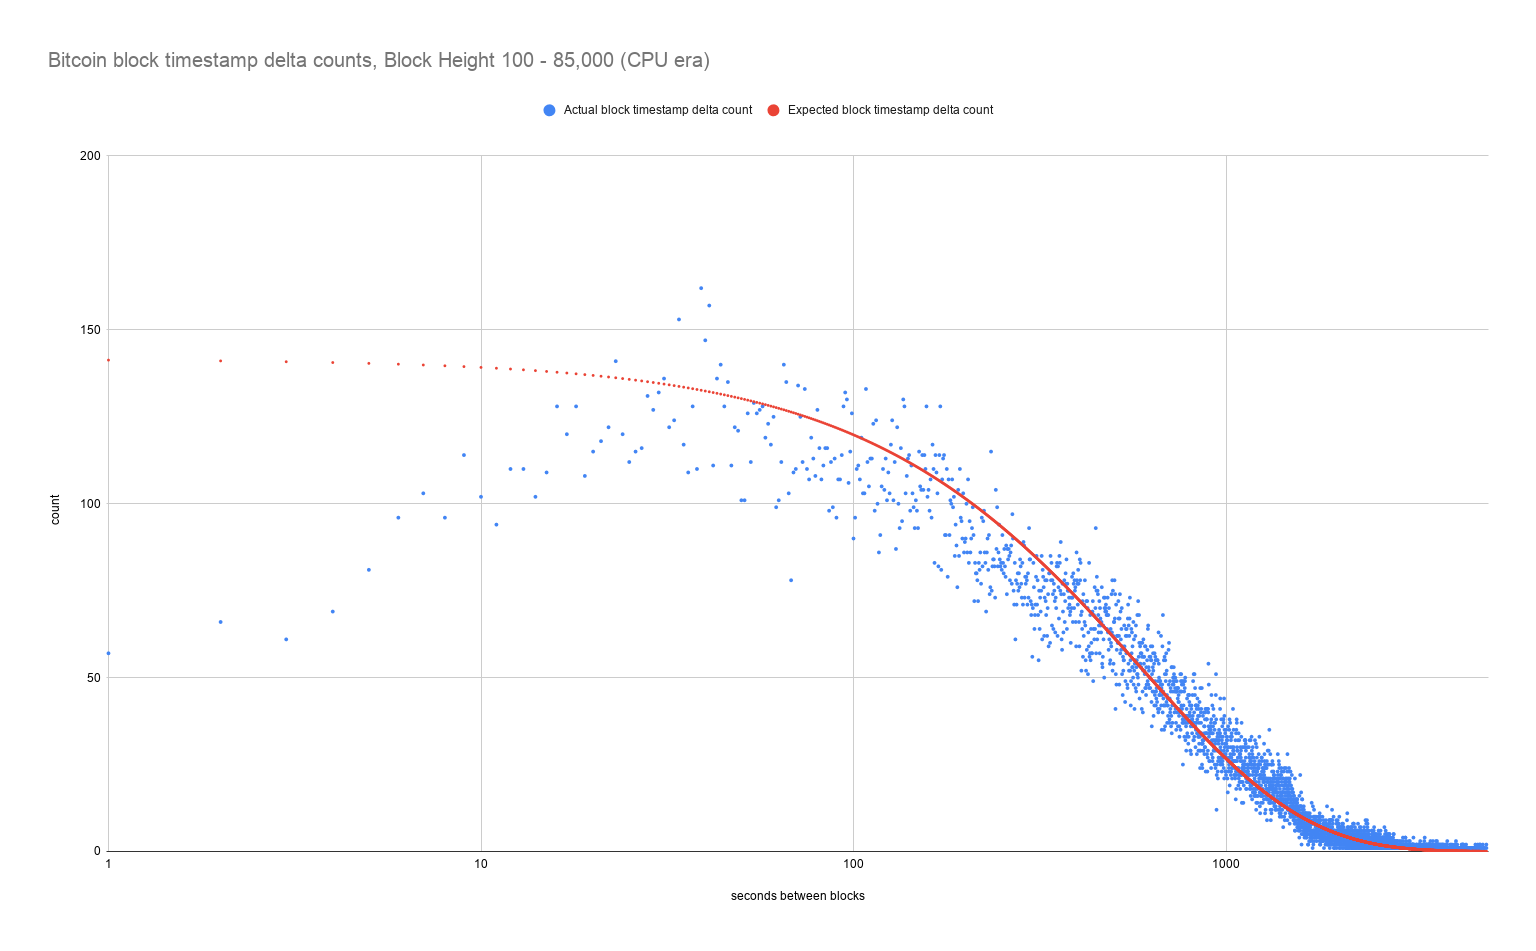
For the CPU mining era it's apparent that for the delta times less than the expected 10 minute target, there are far fewer blocks than expected. Why? We'll get to that later.
GPU Era
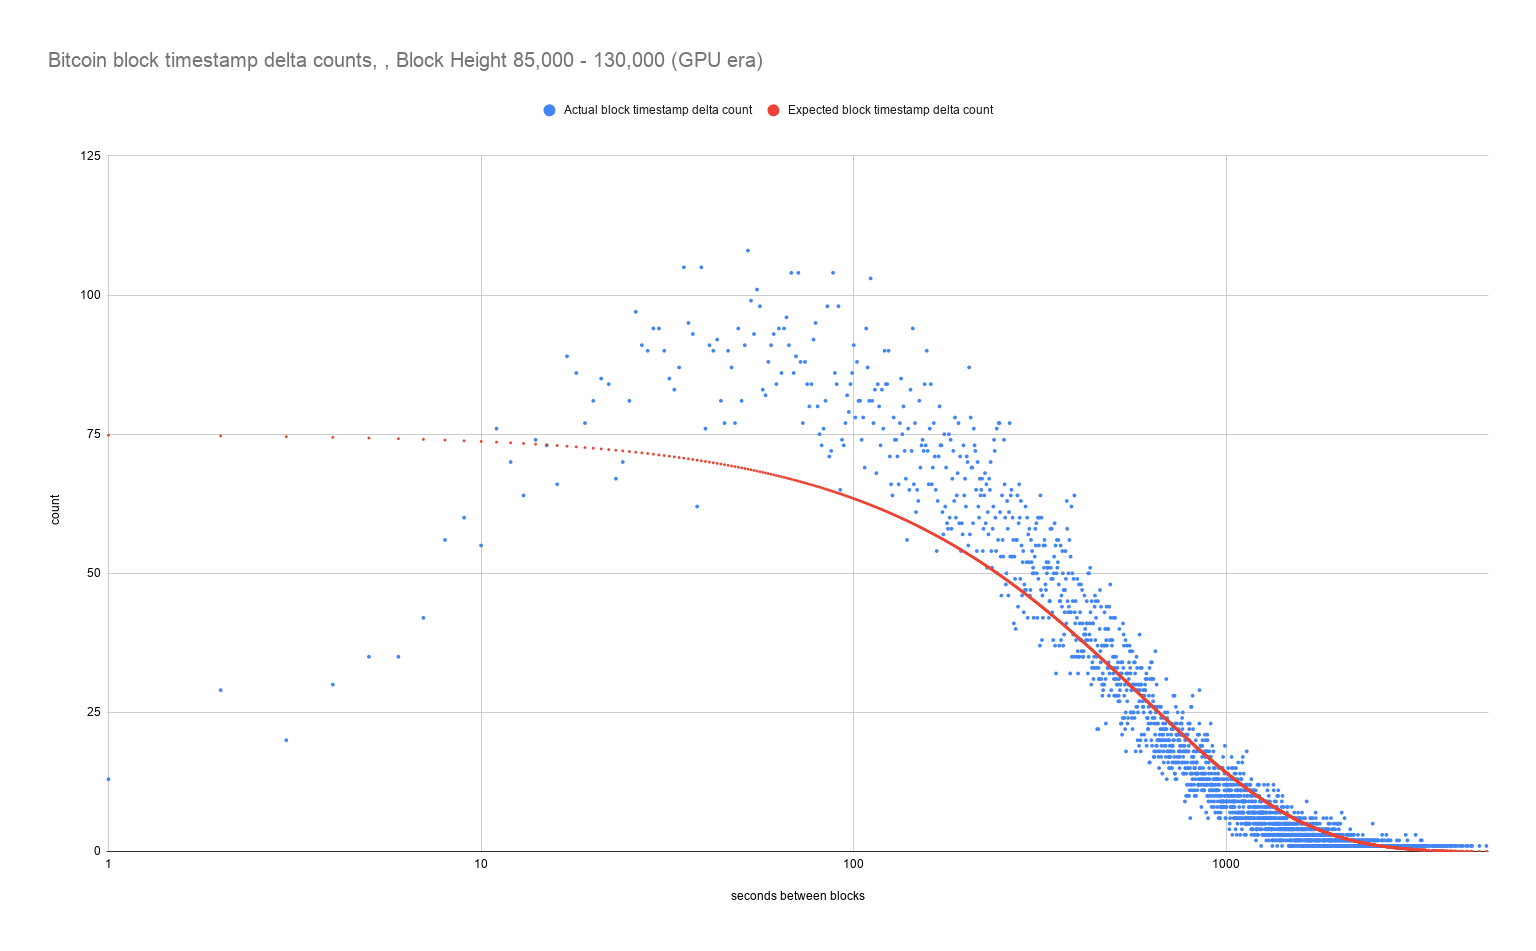
Notice how during the GPU era the opposite occurred for block times less than the 10 minute target - Bitcoin tended to overproduce on "faster than expected" blocks. This is most likely because the hashrate was accelerating.
ASIC Era
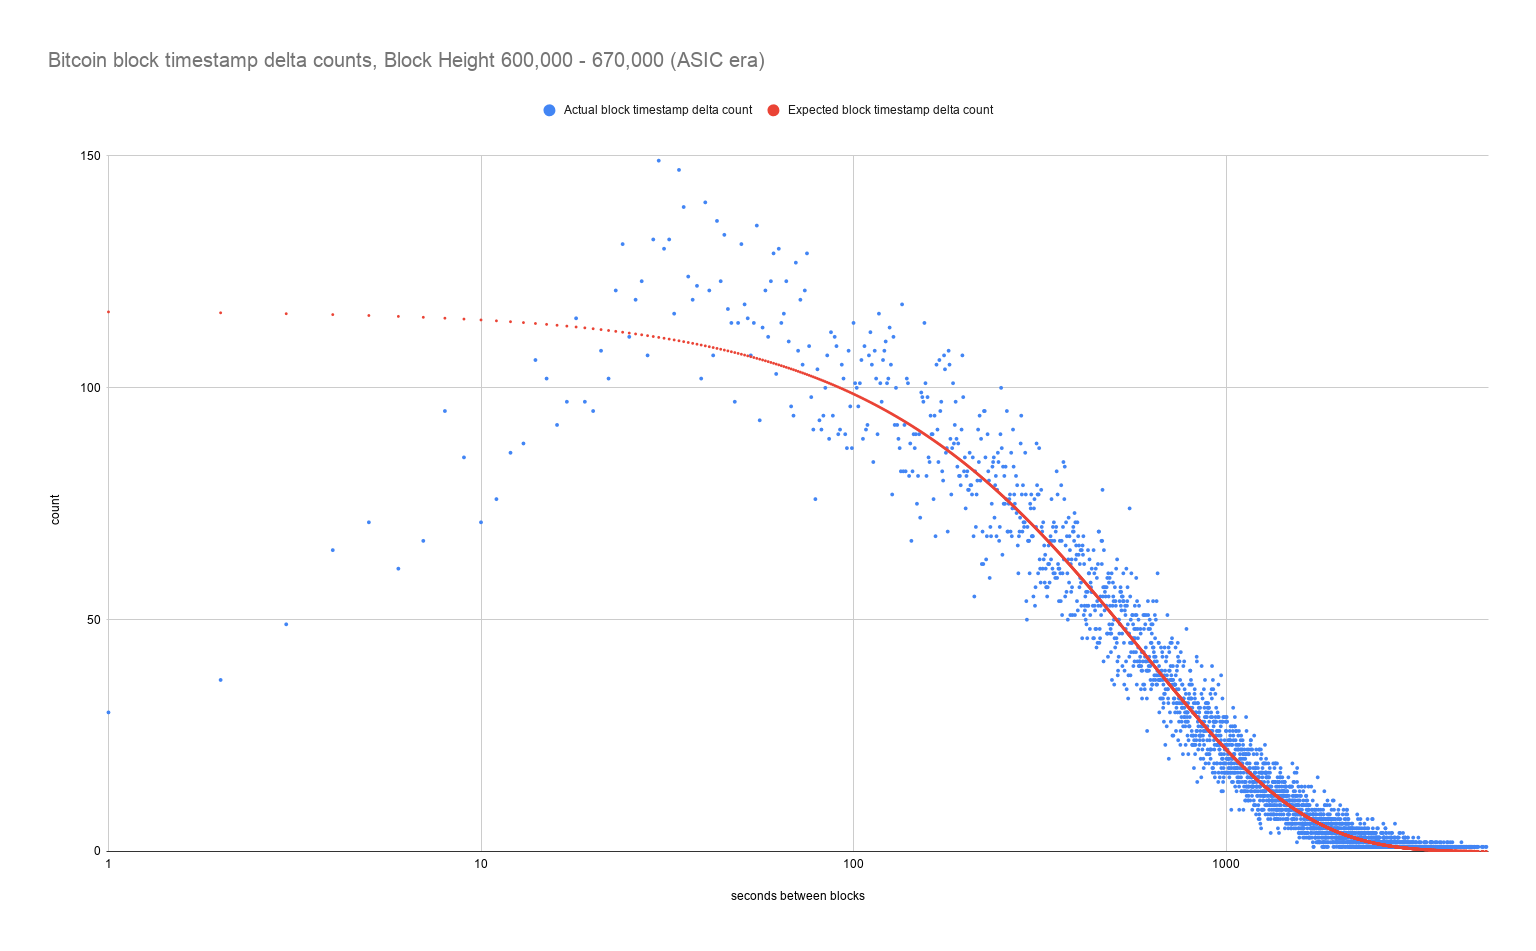
I purposely chose a section of recent history here so that it wouldn't be affected by the massive hashrate acceleration in the early ASIC era. We can see that Bitcoin miners are still overproducing on "faster than expected" blocks, but not nearly to the same extent as the GPU era.
All Mining Eras
What happens when we plot the results from all 670,000 blocks on one chart? We can see that the actual timestamp deltas fit the expected curve quite well. Except... for the shorter time periods on the left of the chart.
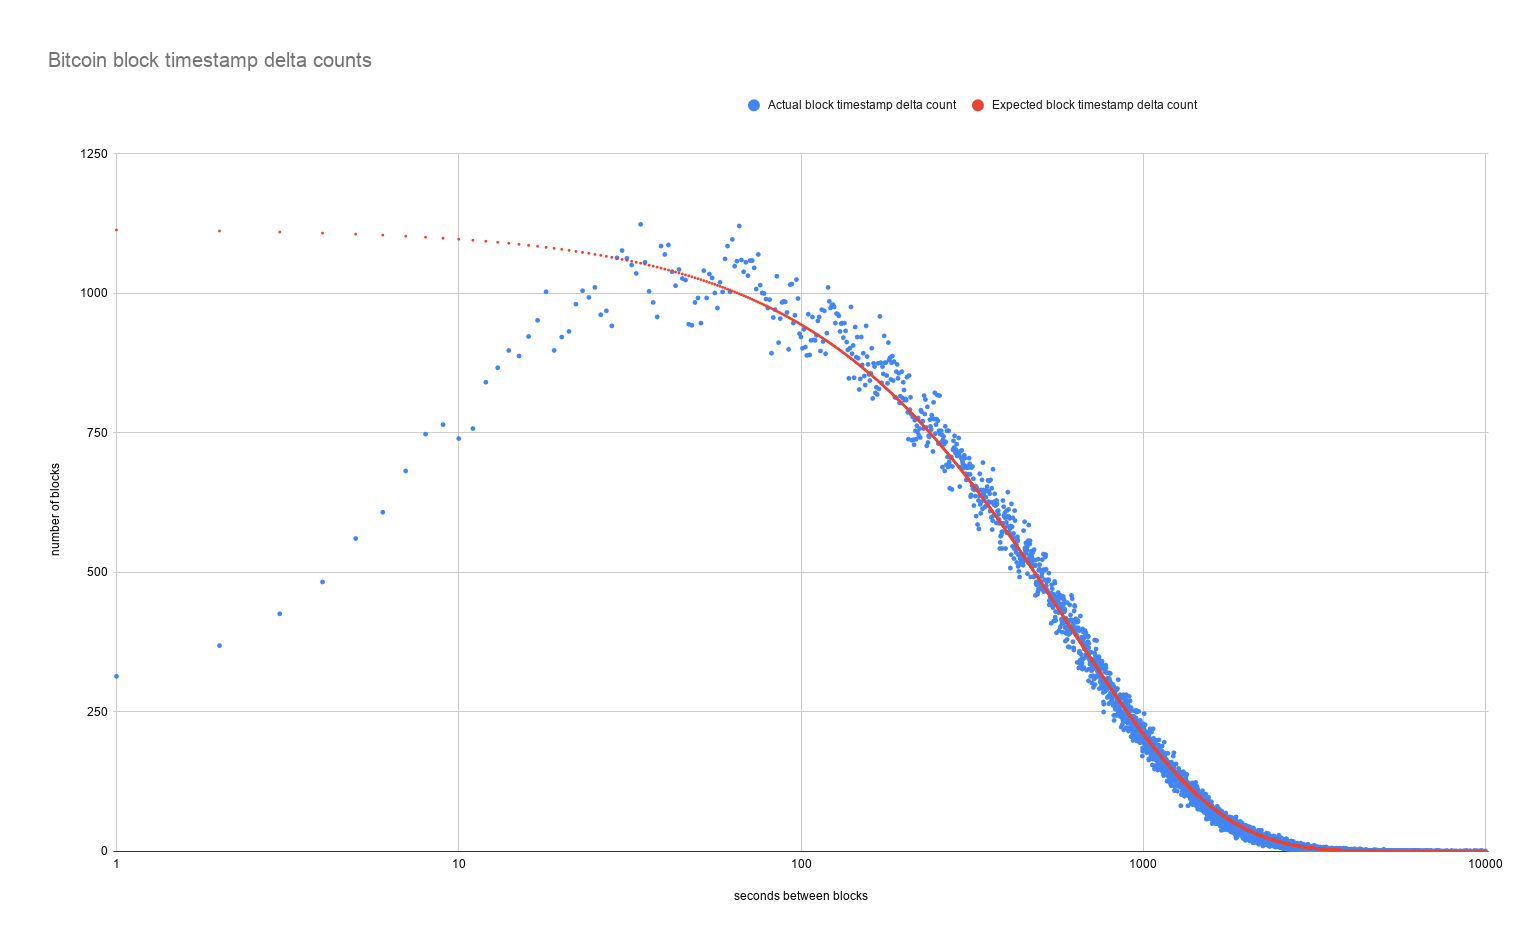
We can see that blocks created 29 seconds or less after the parent block tend to be far lower than expected. Is there a reasonable explanation for the mismatch?
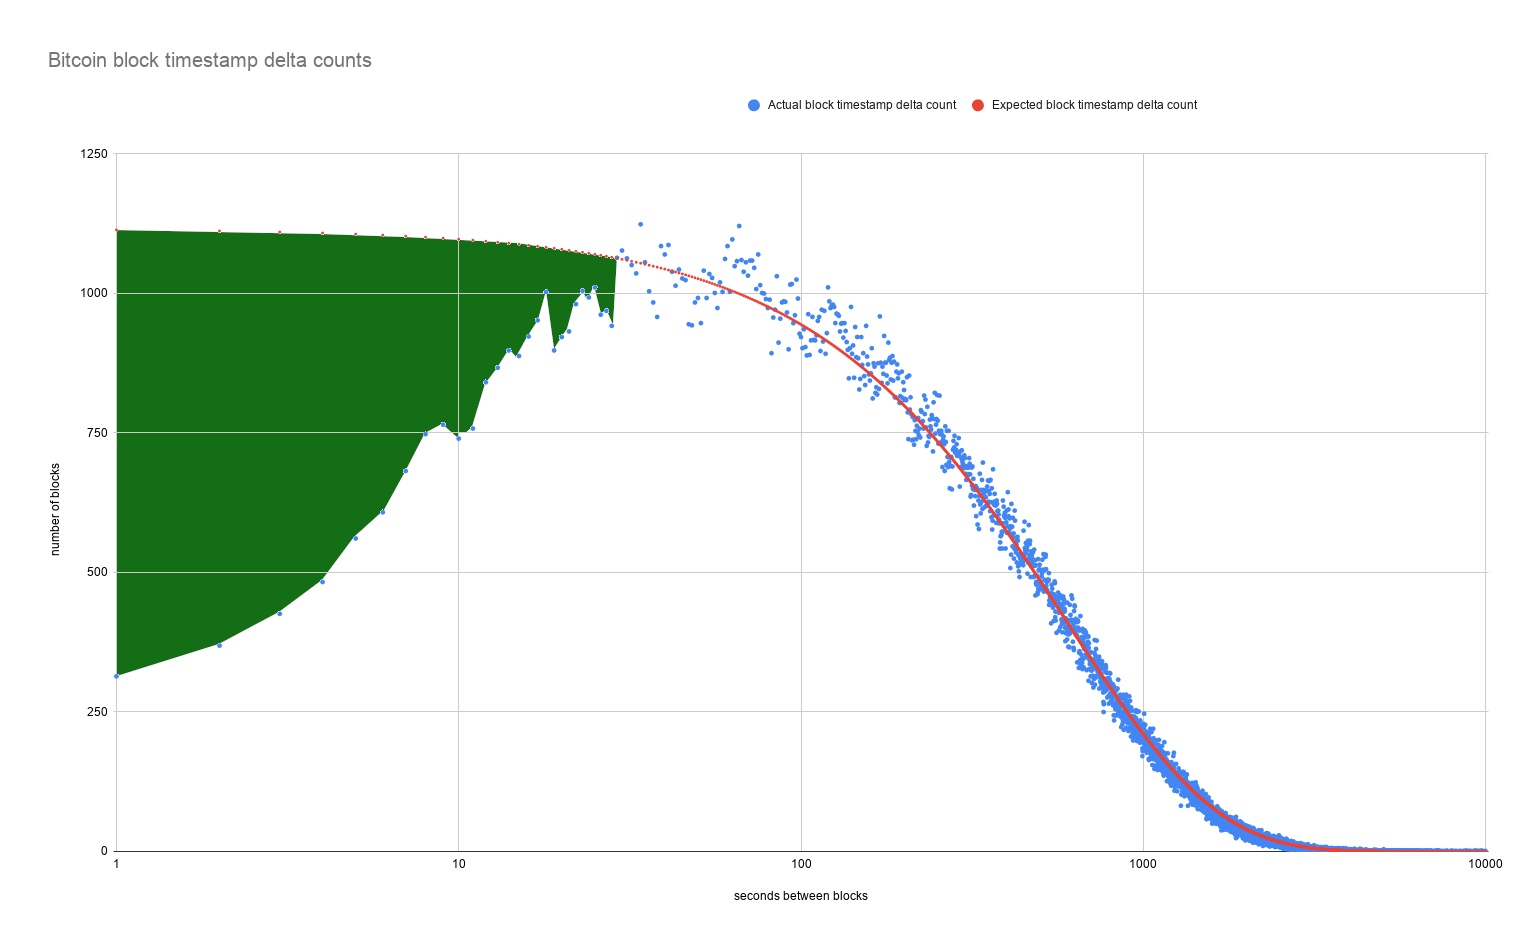
Hunting Down the Deviation
The total number of expected blocks that should have been minted with this range of timestamp deltas was 30,497
On the other hand, the ACTUAL number of minted blocks with this range of timestamp deltas was 22,441
So where are these 8,056 blocks?
Did you know that the timestamp in a bitcoin block header can be BEFORE the timestamp in the previous block? This is allowed as long as it isn't before the median timestamp of the past 11 blocks.
— Jameson Lopp (@lopp) February 16, 2021
~2% of all bitcoin blocks have a timestamp that is before that of the parent block.
It turns out that there are 14,296 blocks hiding in negative deltas and 3,549 of them are in the -29 to 0 second range. This leaves another ~6,000 blocks that I'll focus on in a moment.
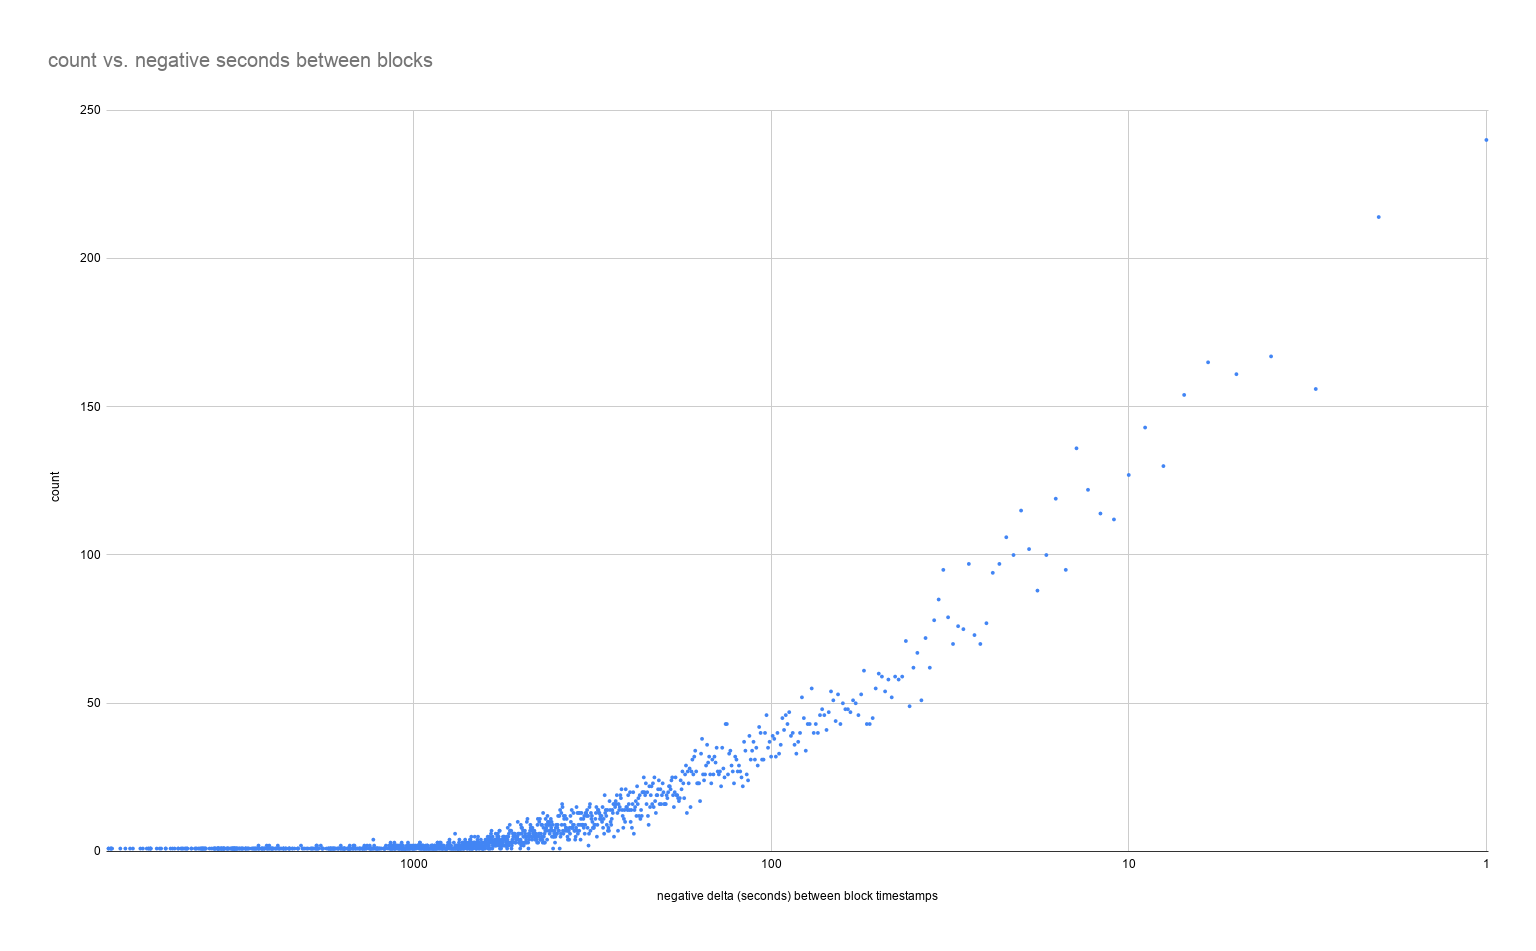
By plotting the distribution of negative timestamp deltas we can see it is basically a mirror image of the positive timestamp distribution.
But while the fact that the Bitcoin protocol allows negative timestamp deltas between blocks is a cause, it's not the root cause! We have to consider how the actual process of mining works:
- A mining pool creates a template for the next block to be mined
- Miners requests work from the pool and start hashing on that template
- Miners return completed work to the pool to prove they tried to solve it
Thus the question becomes: how often do the block templates and their timestamps get updated?
Dynamic in our implementation. Depends on ∆(reward+fee+merged reward) and (time since last template). Avg 10 to 15 sec on our configuration.
— Chun #hodl (@satofishi) February 18, 2021
I'm sure the sophisticated answer is more complex than this, as individual miner machines may also grind (iterate upon) the timestamp itself, but that would probably involve looking at specific hardware / firmware implementations for ASICs.
Recall that there was another excess ~6,000 blocks with negative timestamp deltas - can they be explained? My theory is that yes, they can be explained by clock drift / poorly configured mining software. If you know your mining history then you know that early miners didn't use pools - they "solo mined" on their own. These setups were not run by industrial level enterprises, but hobbyists who probably did not go to the effort of ensuring that their machine was regularly synced to some authoritative source. And even the early pools were generally run by hobbyists rather than full-time professionals. I believed that if my theory was correct, we would see that over time as mining has become more industrialized and as mining pool software has improved, we should see clock drift decreasing. So I ran another script and plotted the distribution of negative timestamp deltas over time.
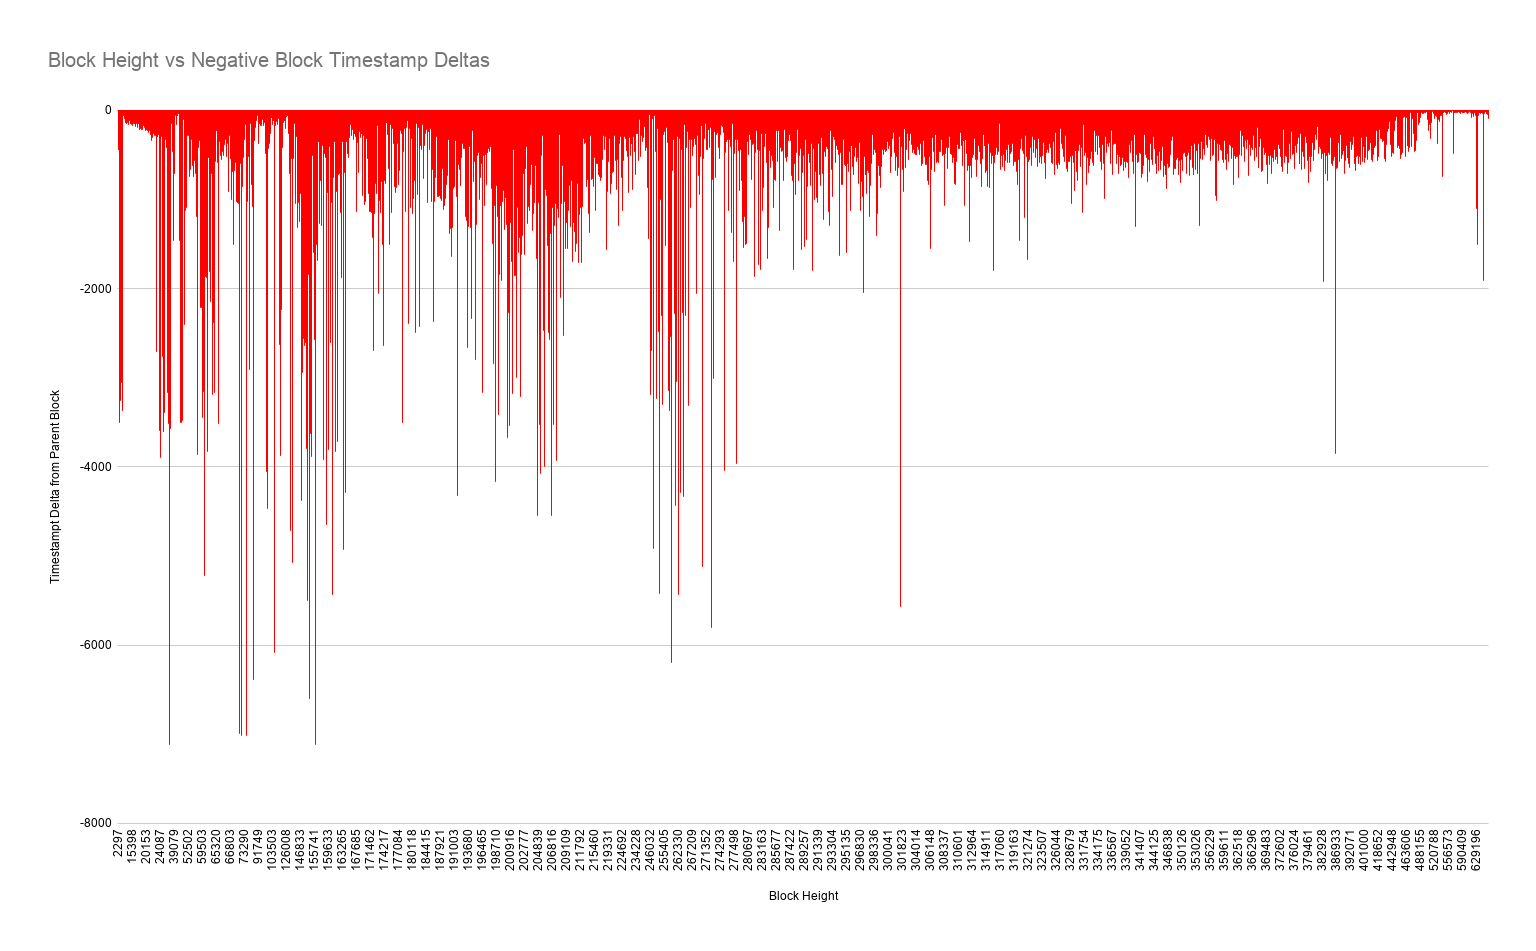
Indeed, we can see that not only is the frequency of negative timestamps diminishing, so is the severity of the clock drift. In particular we have seen very few negative delta timestamps since late 2017.
In Conclusion
Many of Bitcoin's "guarantees" are based upon math. By analyzing the actual distribution of block times we can see that the math behind the targeted block time of 10 minutes has held up quite well over the past 12 years and the few edge case aberrations can be easily explained. The industrialization of mining and continued improvements to mining software have resulted in the realized block time distribution edging closer and closer to the expected block time distribution.
Vires in numeris!