Statoshi Developer’s Guide

Statoshi is a fork of Bitcoin Core with several hundred additional lines of code for emitting metrics to a StatsD instance. You can view the entire set of differences between Bitcoin Core and Statoshi to get a better idea of how it works. This guide is meant to give developers an understanding of the high level statistics available for use in Statoshi, along with best practices for adding new metrics. If you can think of node metrics that may be valuable to expose to the world, you are welcome to submit a pull request!
If you’re new to Bitcoin Core development and you’re a Linux user, you may be interested in reading my guide for setting up a development environment. If you’re an OS X user, this guide may be helpful.
The first thing to note about Statoshi metrics is that they are realtime-only. Any metrics that require scanning historical blockchain data probably won’t be feasible with Statoshi unless Bitcoin Core already has functionality that calculates them and can be triggered via RPC.
Metrics in StatsD are namespaced into “buckets” that are separated by periods in the metric name. We use these buckets to create a metric hierarchy in Statoshi. The current top level namespaces are as follows:
- bandwidth - for metrics related to the node’s bandwidth usage
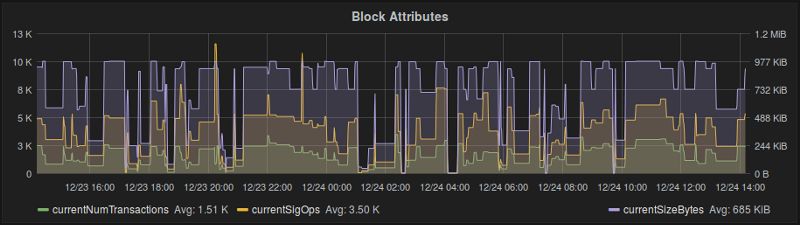
- blocks - metrics related to properties of an individual block
- message - metrics related to p2p messages processed by the node
- misbehavior - metrics related to the node flagging suspicious behavior
- peers - aggregate properties of the peers to which the node is connected
- transactions - aggregate properties of transactions the node processed
- utxoset - properties of the current UTXO set, triggered by RPC
There are also some buckets that you may see getting populated in Graphite / Grafana that are not set from within Statoshi:
- carbon - metrics from the carbon agent that writes StatsD metrics to disk
- system - metrics about the computer that are set by an external daemon
- stats_counts - counts of the metrics processed by StatsD
- statsd - more internal StatsD metrics
It will be slightly more complicated when you’re navigating through the populated metrics in Graphite or Grafana because they are namespaced not only by the buckets but also by the metric types, thus some buckets are duplicated in multiple “type” namespaces. There are several different types of metrics supported by StatsD. Statoshi mostly makes use of counts, gauges, and timers. Thus you may see transaction namespace metrics appear under:
- stats => gauges => transactions => metricName
- stats => timers => transactions => metricName
- stats => transactions => metricName
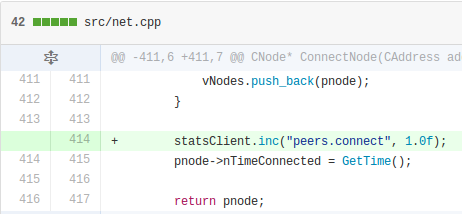
A count is the bread and butter of StatsD. If an event is occurring on a regular basis and you want to track how often that it occurs, you just issue an “inc” command to increment the counter or a “dec” command to decrement it. The important thing to understand is that counts are more like velocities than permanent counters - they will get reset every time StatsD flushes its counters, which is every 10 seconds by default. As an example, the ConnectNode function in net.cpp tracks how often a new peer connects:
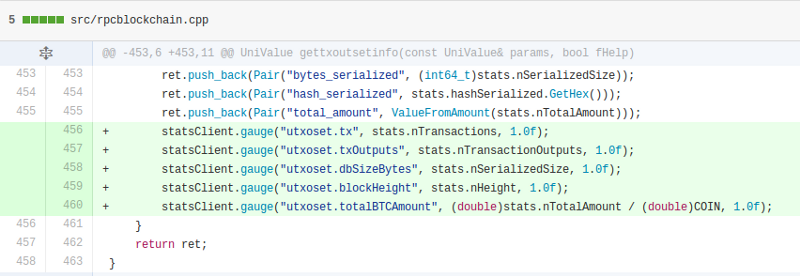
A gauge is a permanent count that does not change unless you explicitly set it to a new value. It is best used for keeping track of global states where you’re interested in the value of the state rather than the frequency at which events change it. For example, the UTXO set metrics are set as gauges in gettxoutsetinfo in rpcblockchain.cpp:
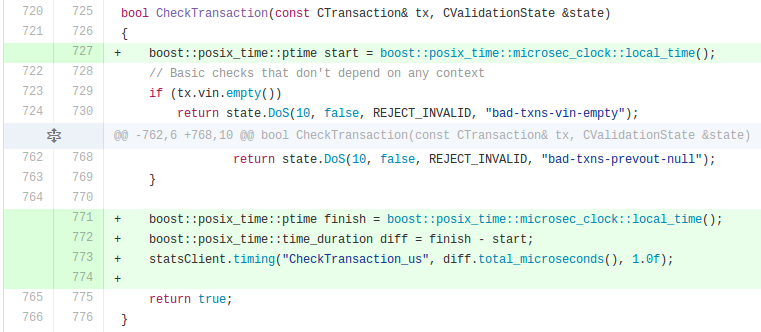
Timers are exactly what they sound like - they are primarily for performance monitoring. The main trick with timers is that you’ll want to ensure that you’re measuring the appropriate magnitude of granularity, be it seconds, milliseconds, or microseconds. Also ensure that you denote the unit of measurement for the timer as a suffix to the metric name.
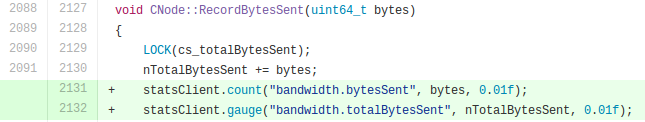
It’s also important to understand what the last parameter to each of the statsClient calls signifies - it’s the sample rate at which the client sends metrics to StatsD. Most of the metrics in Statoshi occur as fairly low frequencies and thus we often use a sample rate of 1 (100%.) But if you’re tracking an event that occurs more than a few times per second then there’s not much point computing the values for every event. We can instead save a lot of CPU cycles by extrapolating from the event frequency. For example, the bandwidth metrics get updated hundreds if not thousands of times per second, thus we only sample 1% of them.
Once you have written code to start populating a new metric in Statoshi, you’ll want to test it. In order to test, you’ll need to compile the project and run bitcoind on a machine that has the rest of the Statoshi software stack installed. Installation instructions are here, though note that you don’t need to install Grafana for testing - you can check the metrics in Graphite. There are three important checks to run after making code changes to Statoshi:
- Are any new metrics being populated with values as expected?
- Are the rest of the metrics still populating as expected?
- Do I need to change the sample rate on the new metrics?
1 & 2 are simple enough - just view the various metrics in Graphite or Grafana. To determine if your sample rate is appropriate, check the CPU usage of the bitcoind and StatsD (nodejs) processes to see if they’re higher than usual. You should also check the stats_counts => statsd => packets_received metric to see if it is substantially higher than it was before the change was implemented. If you see any change, try decreasing the sample rate for the new metrics, recompile, re-check the usage.
Once you’re confident in your changes, you’re ready to submit them as a pull request! I look forward to seeing your proposed metrics and adding them to the dashboards on statoshi.info :-)