Statoshi.info Account Creation Guide
Now you can create, save, and share your own custom dashboards on statoshi.info! It only takes a couple minutes to set up if you follow these instructions:
Create an account at https://statoshi.info/login — you can manually create an email / password combination or you can just link your Google or GitHub account to simplify the process.
Upon creating your account you’ll be logged in and see the main Statoshi dashboard because your account is automatically given read-only access to the Statoshi organization. If you want to create your own dashboards, you’ll need to create a new organization over which you’ll have full admin access.

Start by clicking the Grafana icon in the upper left to bring up the navigation menu.
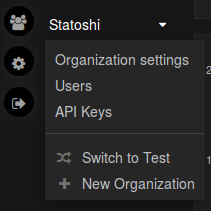
Next, click on “Statoshi” and then click “+ New Organization”
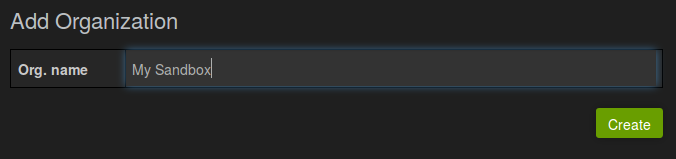
Enter your desired Organization name and click “Create”
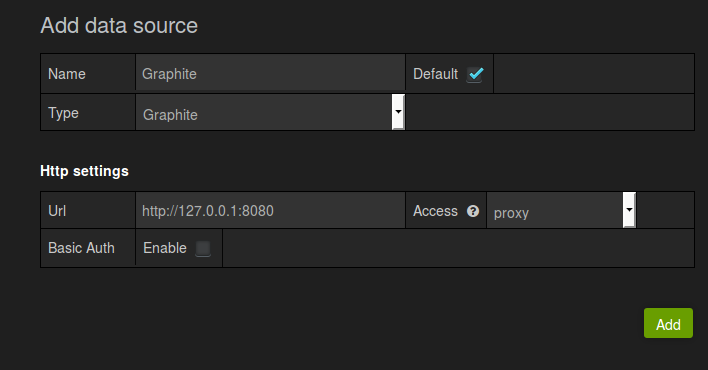
Now you’ll be in your new organization; you can add more details to the organization but it’s not necessary. However, before you can create any dashboards, you first need to add a data source. Click on “Data Sources” in the left-hand menu, then click “Add new” at the top of the screen. Use the settings below (127.0.0.1:8080) to create dashboards using my hosted data, or if you have your own data source, you can point it there.
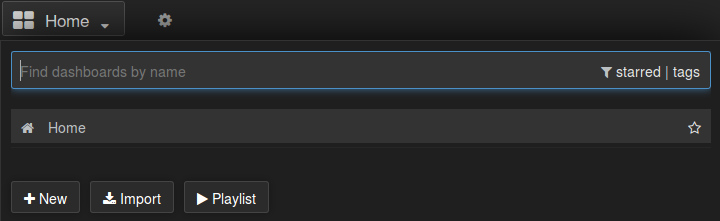
Now you’re ready to start building dashboards! Click on “Dashboards” in the left-hand navigation, then click on “Home” in the top navigation bar and select “+New” to bring up a blank dashboard that you can edit, save, and share.
If you’re new to Grafana, I highly recommend watching Torkel’s Beginner’s Guide to Building Dashboards. Grafana’s user documentation can be found here.
One note regarding dashboard sharing: at time of writing, you can share local snapshots of dashboards (specific time frames) with anyone, though you can only share links directly to realtime dashboards with members of your own organization. Grafana 2.0 is currently beta software under active development; I’ll update this guide if the situation changes.
If you create any charts that you think are insightful, please export the JSON payloads and send them to me; I’ll consider adding them to the default set!