What is the Bitcoin Network's Real Hashrate?
The Bitcoin network is secured by a variety of different mechanisms, one of which is Proof of Work, which makes it extremely expensive for anyone to rewrite the history of transactions in the blockchain. If you want to learn the how and why of mining, check out this article.
Given that this is an important security mechanism for Bitcoin's immutability and trustworthiness as a historical record, one important metric to track is the total aggregate global hashrate that is currently mining. But there's a tricky aspect to trying to calculate this value: individual hashers don't publicly announce themselves to the world.
Trying to measure the Bitcoin network's hashrate is like trying to measure wind velocity. Neither can be directly measured - rather, they must be measured indirectly and estimated by working backwards. As a result, no one can precisely know the total network hashrate.
— Jameson Lopp (@lopp) December 14, 2020
Estimating the Global Network Hashrate
Nearly every hashrate chart, from blockchain.com to Statoshi, calculates the hashrate based upon some range of trailing blocks that were mined before that point in time. How is this estimate calculated?
- Start by computing the total amount of work. Work is defined as the expected number of hashes that were necessary for a particular block. If a block's target is
Target, thenWork = 2256 / (Target + 1). - As the difficulty
Diffis defined asMaxTarget / TargetwithMaxTarget = 65535 * 2208, it follows thatWork = Diff * 248 / 65535 = Diff * 4295032833. - For each block in the time range, look at its difficulty, and compute
Diff * 4295032833. - Compute the sum of all those values for all blocks in your time range.
- Divide the sum of expected work by the number of seconds your interval lasted, which is the timestamp of the parent block of the first block in the time range subtracted from the timestamp of the last block in the range. The result is your average number of hashes per second during that interval.
If this sounds like a pain, don't worry - anyone with a Bitcoin Core node can just call a single command to perform the calculation instantly!
bitcoin-cli getnetworkhashps [trailing # of blocks] [block height]For example, I estimated the network hashrate at block height 784,978:
| Trailing Blocks | Estimated Hashrate |
|---|---|
| 1 | 4470 EH/s |
| 5 | 375 EH/s |
| 10 | 334 EH/s |
| 100 | 332 EH/s |
| 1,000 | 342 EH/s |
| 10,000 | 322 EH/s |
That 1-block estimate is correct and not a typo! We'll dig into it later on.
Hashrate Estimate Discrepancies
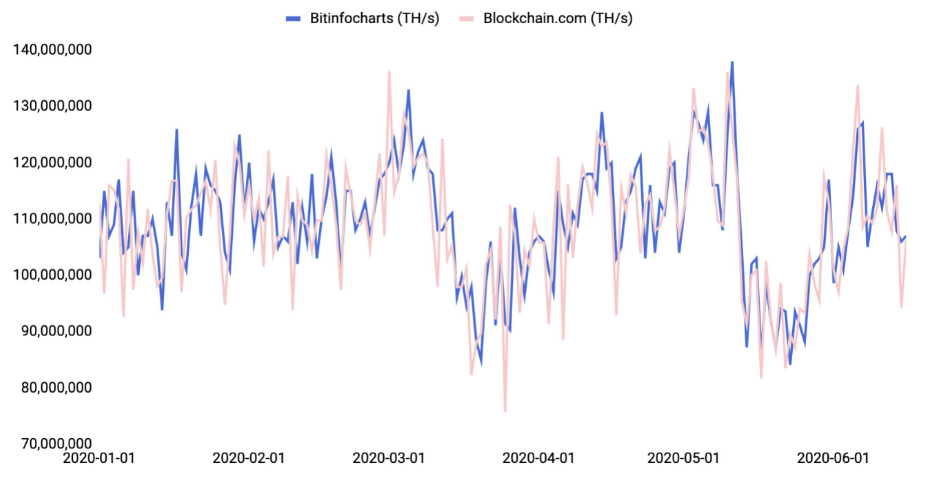
One issue with various hashrate charts strewn across the internet is that they often don't tell you what formula / trailing time range they are using for the estimate. Thus you end up with different sites reporting similar but out-of-sync numbers. Inevitably, some naive folks or even journalists will see a peak or trough on one chart and loudly proclaim that it's newsworthy, when it often is not - it's just an aberration in the estimate due to the randomness inherent to block discovery.
The variance in miner success (since it's a Poisson process) over a given length of time will affect the estimate's accuracy. Looking at very short time frames is problematic because any given block may take an inordinately long or short period of time to find, which could "trick" your estimate into thinking the hashrate is far higher or lower than it actually is. But on the flip side, too long of a time frame and your accuracy is likely affected by the fact that the global hashrate actually is changing as miners add and remove machines from the network.
Stop 👏 using 👏 10 👏 block 👏 average 👏 block 👏 time 👏 to 👏 estimate 👏 network 👏 hashrate 👏 pic.twitter.com/VO7DvtZYcc
— Braiins (@BraiinsMining) March 27, 2023
Hashrate Index's Recommendations
Hashrate Index charts Bitcoin’s hashrate across three simple-moving-average (SMA) timeframes: 3 days (432 blocks), 7 days (1,008 blocks) and 30 days (4,320 blocks).
The 3 day or 432 blocks time frame is useful because it is very current. You can easily spot massive disruptions to the Bitcoin mining hashrate from events like China’s Mining Ban, for example. The downside of the 3 day view is that faster or shorter blocks can distort the hashrate estimate, making Bitcoin’s total hashrate appear larger or smaller than it really is.
While less current than the 3 day, the 7 day or 1,008 blocks hashrate metric is less influenced by bitcoin mining luck and block times, and so miners see it as a more accurate estimate. The 7 day metric is the industry standard for hashrate reporting.
Lastly, the 30 day or 4,320 blocks SMA smooths outs most of the noise cause by variance to block times but heavily lags short-term trends.
Kraken's "True Hashrate"
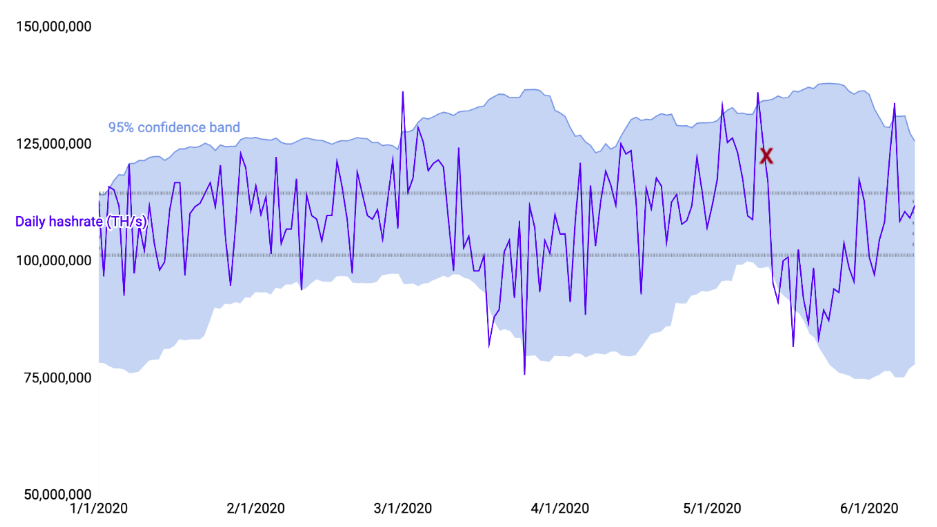
Per this report, to calculate Bitcoin's "True Hashrate," Kraken uses a 30-day rolling average of the estimated daily hashrate and its standard deviation to calculate a rolling 95% confidence interval.
daily hashrate = blocks found / expected blocks * diff * 232 / 600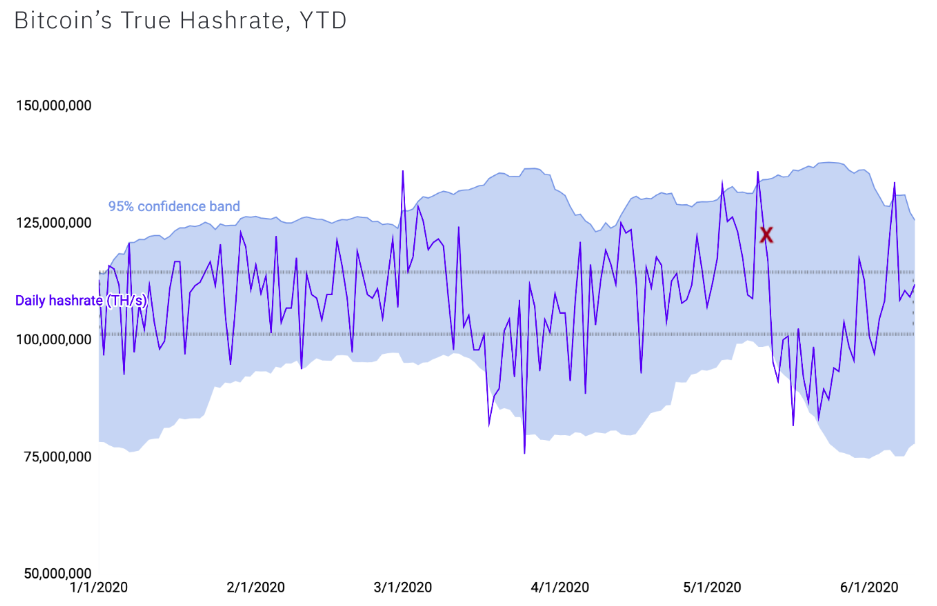
At least for the date range pictured above, I must say that this is a pretty huge margin of error in order to achieve 95% confidence. The confidence range looks to be nearly 40% of the daily estimate value!
Visualizing Hashrate Estimate Volatility
I gave a single point-in-time set of hashrate estimates earlier to showcase how different the result can be based upon the length of time over which you are calculating the estimate. But to really show how inaccurate the estimates can be, we should look at many different trailing block lengths across many different block heights.
I wrote this script to query my node for a wide range of hashrate estimates from 1 to 10,000 trailing blocks. By running it over the block height range of 784,000 to 785,000 it generated this data.
For the next several graphs we'll look at this recent slice of 1,000 blocks - about 1 week's worth. Note that the real global hashrate during this time period is around 350 exahash per second. As we'll see, the shorter the timeframe of trailing blocks you use to calculate an estimate, the more wildly inaccurate it will be. First off, let's look at estimates that use only the most recent 1 to 10 blocks.
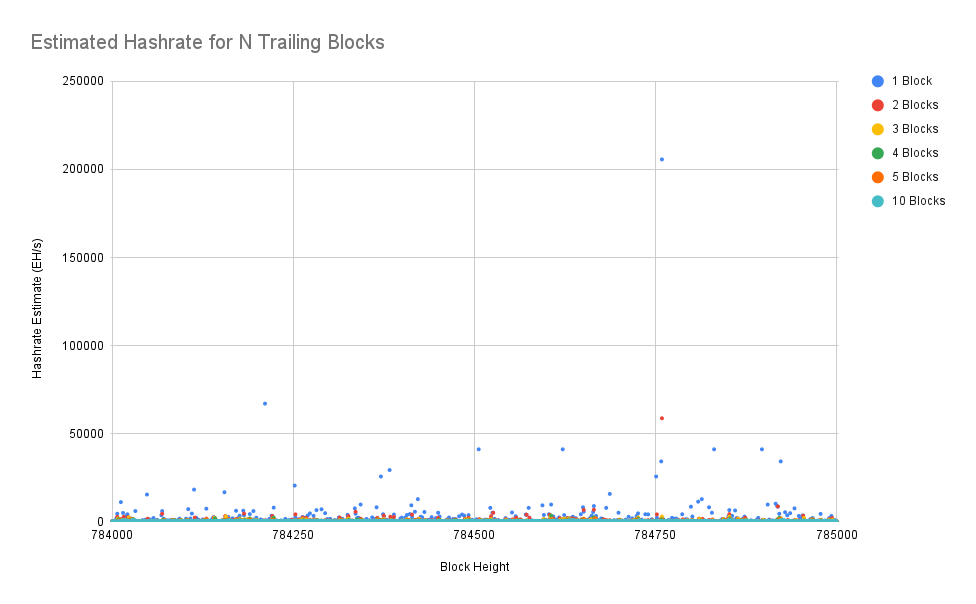
I debated using a log scale on the Y axis for this chart, but decided against it just so that you can more easily compare with the following charts. Recall that the expected amount of time to mine a block is 600 seconds. As we can see, since sometimes you'll get a really fast block that is mined only a second or two after the previous block, that can result in the hashrate estimate being over 500X of the real hashrate!
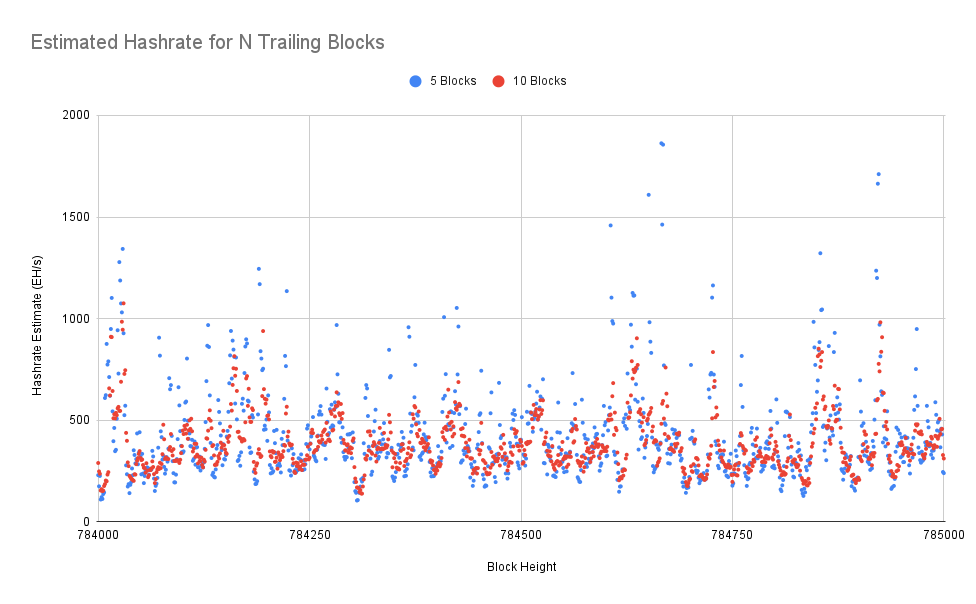
Let's remove estimates using less than 5 trailing blocks so that we can zoom in a bit. Here we can see that 5 block estimates can still easily give results that are 5X the real hashrate while 10 block estimates are generally within 3X the real hashrate. That's still pretty bad if your goal is to have any semblance of accuracy to reality!
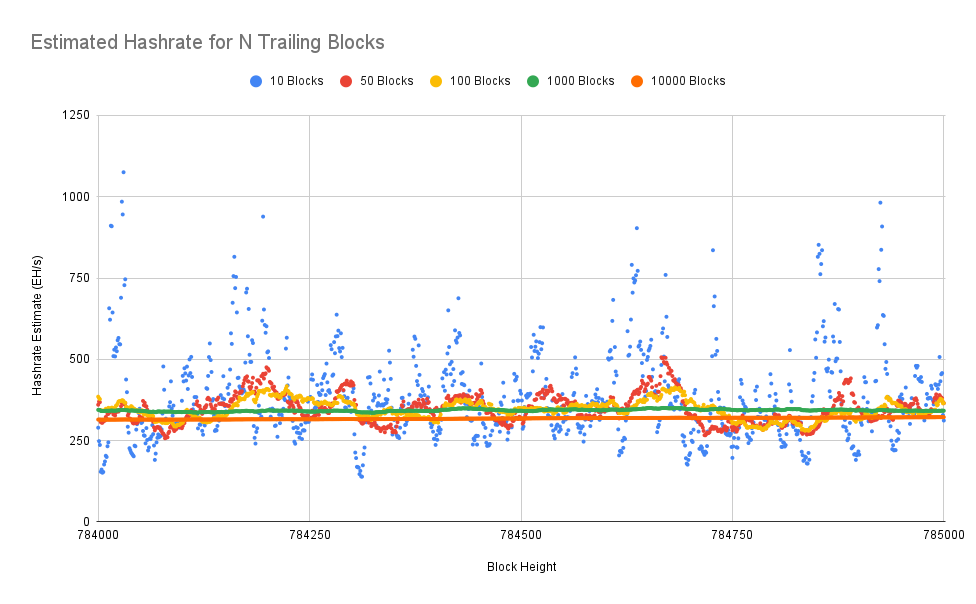
Finally, we'll zoom out even further and look at estimate time scales all the way to 10,000 blocks (10 weeks.) We can see the volatility being dampened and once you get to 1,000 trailing block estimates, the results look quite accurate at around 350 EH/s during this time frame. On the other hand, once you continue increasing the time frame you aren't really dampening the volatility - you're just getting a lower estimate because you're including data from so long ago that the actual network hashrate was significantly lower.
Realtime Reported Hashrate
This far we've seen a couple different ways to estimate the global hashrate based upon observable blockchain data. However, the blockchain is NOT the only available hashrate data!
It turns out that mining pools offer realtime metrics of the hashpower being pointed at the pool, which they can know much more precisely by keeping track of how many shares of work are being requested and returned by individual hashers. Of course, the mining pools could publish any numbers they want on their web sites and we can't verify them.
At the time I ran the blockchain-based estimates above (block 785,000), the aggregate hashrate reported by the mining pools was 362 EH/s, which is pretty close to our estimated 340 - 350 EH/s network hashrate we were seeing from the 1,000 block estimates.
Conclusions and Future Research
We've seen that on one hand we can get a trustless (math-based) estimate of the network's hashrate by simply observing some recent range of trailing blocks, but these estimates can be highly inaccurate. Or we can choose to trust a bunch of numbers from pools that have the potential to be more accurate.
Whenever you see someone claiming that a change in the network hashrate is newsworthy, you should always question the method and time range used to achieve the hashrate estimate. Personally, I'd raise my eyebrows at any estimates based upon time ranges less than a week / 1,000 blocks. Remember that Satoshi chose the difficulty adjustment to happen every 2,016 blocks and thus it recalculates the difficulty based upon a hashrate estimate that uses the trailing 2,016 blocks. While Satoshi didn't explain why they chose that specific value, it's quite likely that they understood that shorter time periods could result in too much volatility and thus inaccurate difficulty adjustments.
Going forward, I think a particularly interesting area of research will be to compare the realtime reported hashrate from pools against a variety of backwards-looking estimates to see if we can find an on-chain trustless calculation that clearly is an optimal fit with the realtime reported hashrate. Or perhaps we will find that the realtime reported hashrate itself is questionably inaccurate! I'm not sure how long this research will take because it will depend upon me finding a historical archive of the realtime reported hashrate, otherwise I'll have to start collecting the data myself.